Original article
Ukrainian Neurosurgical Journal. 2025;31(1):41-54
https://doi.org/10.25305/unj.319903
1 Department of Neurosurgery, Bogomolets National Medical University, Kyiv
2 Restorative Neurosurgery Department, Romodanov Neurosurgery Institute, Kyiv
3 Department of Cellular Membranology, Bogomoletz Institute of Physiology, Kyiv
4 Laboratory of Cell and Tissue Cultures, Institute of Genetic and Regenerative Medicine, M.D. Strazhesko Institute of Cardiology, Clinical and Regenerative Medicine, Kyiv
5 Department of Histology and Embryology, Bogomolets National Medical University, Kyiv
6 Department of Pathophysiology, Bogomolets National Medical University, Kyiv
7 Department of Sensor Systems, V. Lashkaryov Institute of Semiconductor Physics of National Academy of Sciences of Ukraine, Kyiv
8 Department of Ion-Beam Engineering and Structural Analysis, V. Lashkaryov Institute of Semiconductor Physics of National Academy of Sciences of Ukraine, Kyiv
Received: 31 December 2024
Accepted: 27 January 2025
Address for correspondence:
Ziia K. Melikov, Department of Neurosurgery, Bogomolets National Medical University, 32 Platona Mayborody st., Kyiv, 04050, Ukraine, e-mail: melikov_ziya@ukr.net
Peripheral nerve injury (PNI) is a common pathology during wartime, significantly complicating the course and treatment of limb damage. Restorative treatment of PNI requires substantial improvement, which is impossible outside the methodology of experimental neurosurgery. The most frequently used PNI model involves transection of the rat sciatic nerve, followed by observation over 9–12 weeks and verification of results using functional-anatomical, electroneuromyographic, and morphometric methods. A key pathophysiological question—whether there is a correlation between the results of these three classes of research methods—remains a topic of ongoing debate.
Objective: to determine the correlation between individual values of the sciatic functional index (SFI), the amplitude and latency of the M-response, as well as the density of nerve fibers in the injured sciatic nerve 12 weeks after its transection and neurorrhaphy.
Materials and Methods: This study was conducted on adult male white outbred rats, selected from groups analyzed in a previous publication, which underwent electroneuromyographic and morphological examinations. In the sham-operated group (Sham; n=6), a surgical approach to the sciatic nerve was performed without nerve injury. In the Sect group (n=7), the sciatic nerve was transected in its middle third. In the Raph group (n=6), the stumps of the transected sciatic nerve were immediately sutured in an end-to-end way using several interrupted stitches. Twelve weeks post-surgery, SFI was calculated using the Bain–Mackinnon–Hunter formula. Additionally, the amplitude and latency of the M-response and specially calculated density of nerve fibers in three main sections of the sciatic nerve (proximal, central, and distal parts) were determined using longitudinal sections impregnated with silver nitrate (Sham — n=4, Sect — n=7, Raph — n=6). Quantitative data processing and statistical correlation analysis were performed using mathematical statistics tools.
Results: Against the background of significant differences in the mean SFI values across all samples, a statistically significant difference was also found in the M-response amplitude for three pairs of sample comparisons, in the M-response latency (when comparing the values of the Sham and Sect groups, as well as the Sham and Raph groups), and in the density of nerve fibers (for the proximal part, central part or neuroma, and distal part of the nerve in three pairs of comparisons). Within each group, a statistically significant (strong negative) correlation was observed only between the M-response latency and the nerve fiber density in the distal section of the nerve in the Raph group. When combining the results from all groups into one cohort, significant correlations were found between individual values of the M-response amplitude and latency, SFI and M-response amplitude, SFI and M-response latency, SFI and nerve fiber density across all three nerve sections, M-response amplitude and nerve fiber density in all sections, and M-response latency and nerve fiber density in the central section of the nerve or neuroma.
Conclusions: There is a correlation between the sciatic functional index, M-response amplitude and latency, and the density of sciatic nerve fibers. The statistical significance of these correlations becomes evident only with a sufficient number of observations and a broad range of individual values for the mentioned parameters.
Keywords: peripheral nerve injury; neurorrhaphy; sciatic functional index; M-response amplitude; M-response latency; nerve fiber density; correlation
Introduction
Peripheral nerve injury (PNI) is generally considered the simplest and most prognostically favorable type of nervous system trauma for obvious reasons. However, it is also characterized by long-term, often lifelong impairments in motor function, sensory deficits, and chronic pain [1–5]. In peacetime, the incidence of this pathology remains relatively low [6–9]. However, during armed conflicts, its frequency is likely to increase due to the high occurrence of combat-related limb injuries [10, 11], where PNI is often associated with damage to major blood vessels and tubular bones [12–16]. In such cases, several factors significantly worsen the outcomes of PNI treatment [10, 17, 18].
Several factors contribute to the substantial socioeconomic impact of PNI: 1) the majority of those affected are men of prime working age [6–9, 19, 13]; 2) the most frequently injured nerves are those of the upper limbs, particularly in the wrist and hand regions [6–8, 13, 19, 20]; 3) the primary treatment for PNI is predominantly surgical [3–5, 7–9, 21]; 4) these patients typically require prolonged rehabilitation therapy afterwards [5]. These aspects contribute to significant financial costs [6, 20, 22–24].
Despite the nervous system's considerable capacity for self-repair following PNI and notable advances in treatment approaches [4, 21, 25–30], therapeutic efficacy remains limited [4, 31]. This limitation is due to several factors: the lack of satisfactory conditions for nerve fiber growth through the injury site [28], the death of neurons whose axons were damaged during the PNI — particularly brain neurons [32–34], restricted compensatory plasticity of brain neural networks [35–37], and rapid atrophy of muscles deprived of innervation as a result of PNI [31, 38–40]. Therefore, improving PNI treatment outcomes could be achieved by optimizing conditions for nerve fiber regeneration at the injury site [28, 41], maintaining the viability of injured neurons [32–34], stimulating the plasticity of their networks [35–37], and limiting the atrophy of denervated muscles [31, 40].
The development of any of these approaches is impossible outside the methodology of experimental neurosurgery. The optimal design for PNI research typically involves modeling the transection of a rat’s sciatic nerve with immediate suture connection, followed by observation over 9–12 weeks and verification of results through clinical-functional tests, electroneuromyography, and morphometric analysis [42]. Arguably, the most widely used comprehensive tool for evaluating motor function and the macroscopic morphology of a paretic limb is the sciatic functional index (SFI) [43]. Currently, data on the correlation of results from these three assessment methods in sciatic nerve injury under experimental conditions remain inconsistent [44–48].
Objective: to determine the correlation between individual SFI values, the M-response amplitude and latency, and the density of nerve fibers in the injured sciatic nerve 12 weeks after its transection and neurorrhaphy.
Materials and Methods
Experimental animals and groups
The study was conducted on 19 white outbred male rats aged 4–6 months, weighing 280–380 g, obtained from the vivarium of the A.P. Romodanov Institute of Neurosurgery of the National Academy of Medical Sciences (NAMS) of Ukraine. The animals were kept under standard laboratory conditions. The study design was approved by the Bioethical Expertise and Scientific Research Ethics Committee of the Bogomolets National Medical University (Minutes No. 155 dated January 31, 2022) and the Bioethics Committee of the Romodanov Neurosurgery Institute of the NAMS of Ukraine (Minutes No. 39 dated May 18, 2022). The animals were selected from a general population (n=42), the SFI study results of which were presented in a previous publication [49].
Three experimental groups were formed: 1) Sham-operated animals which underwent surgical access to the sciatic nerve (Sham; n=6), 2) animals, which underwent complete sciatic nerve transection (sectio) in the middle third (Sect; n=7), 3) animals which immediately after complete sciatic nerve transection, underwent neurorrhaphy (neurorrhaphia, or neurorraphia) of the stumps (Raph; n=6).
Peripheral nerve injury model
The surgical techniques used in the experimental groups were described in detail in a previous study [49]. All procedures were performed under general anesthesia and deep muscle relaxation, achieved through intraperitoneal administration of a mixture of xylazine hydrochloride (15 mg/kg, “Biowet”, Poland) and ketamine hydrochloride (75 mg/kg, “Farmak”, Ukraine) under mild aseptic conditions. The animals were placed in a prone position, and surgical access to the sciatic nerve was achieved through a linear skin incision along the outer surface of the femur, followed by cutting the tendon of the short head of the biceps femoris muscle. After isolating the sciatic nerve trunk, the procedure was completed in the Sham group without further intervention. In the Sect and Raph groups, the nerve was completely transected. In the Raph group, the nerve stumps were reconnected using an end-to-end epineural suture technique with 3–6 monofilament stitches (8.0–10.0; “Ethicon”, USA) under 14x magnification. In all groups, the surgical wound was closed with two layers of interrupted sutures, and the skin incision was treated with povidone-iodine solution (Betadine, “EGIS”, Hungary). For systemic pain management and anti-inflammatory therapy, bicillin-5 (“Arterium”, Ukraine) was administered subcutaneously in the posterior cervical region at a dose of 1 million IU/kg body weight, while dexamethasone (“KRKA”, Slovenia) was injected intraperitoneally at a dose of 6 mg/kg body weight. Until satisfactory behavioral activity was restored, the rats were kept at an elevated ambient air temperature, after which they were housed in groups of 3–6 animals per cage.
Exclusion Criteria
No animals in the study population exhibited signs of purulent-inflammatory complications, trophic ulcers of the paretic limb or adjacent areas, or autophagy. For reasons not specifically investigated, two animals from the Sect sample died during the observation period; their deaths occurred within the first week but more than 48 hours post-intervention. These animals were not included in the declared study population (n=19), and data obtained from them were excluded from analysis.
Assessment of Sciatic Functional Index
The SFI was determined using a standard methodology [45, 50, 51] with proprietary technical modifications [49] in all experimental groups and samples 12 weeks after peripheral nerve injury (PNI) modeling (Fig. 1). Variations in the actual testing periods among the experimental animals did not exceed 5% of the corresponding observation periods and concerned five animals from the Raph sample. Footprints were obtained on a paper strip covering the floor of a tunneled horizontal walkway, and SFI was calculated using footprint measurements based on the Bain–Mackinnon–Hunter formula [45]:
![]()
where SFI represents the sciatic functional index;
E denotes the injured limb, and N denotes the intact limb;
PL is the distance between the heel print and the longest toe print;
TS is the distance between the first and fifth toe prints;
and IT is the distance between the second and fourth toe prints.
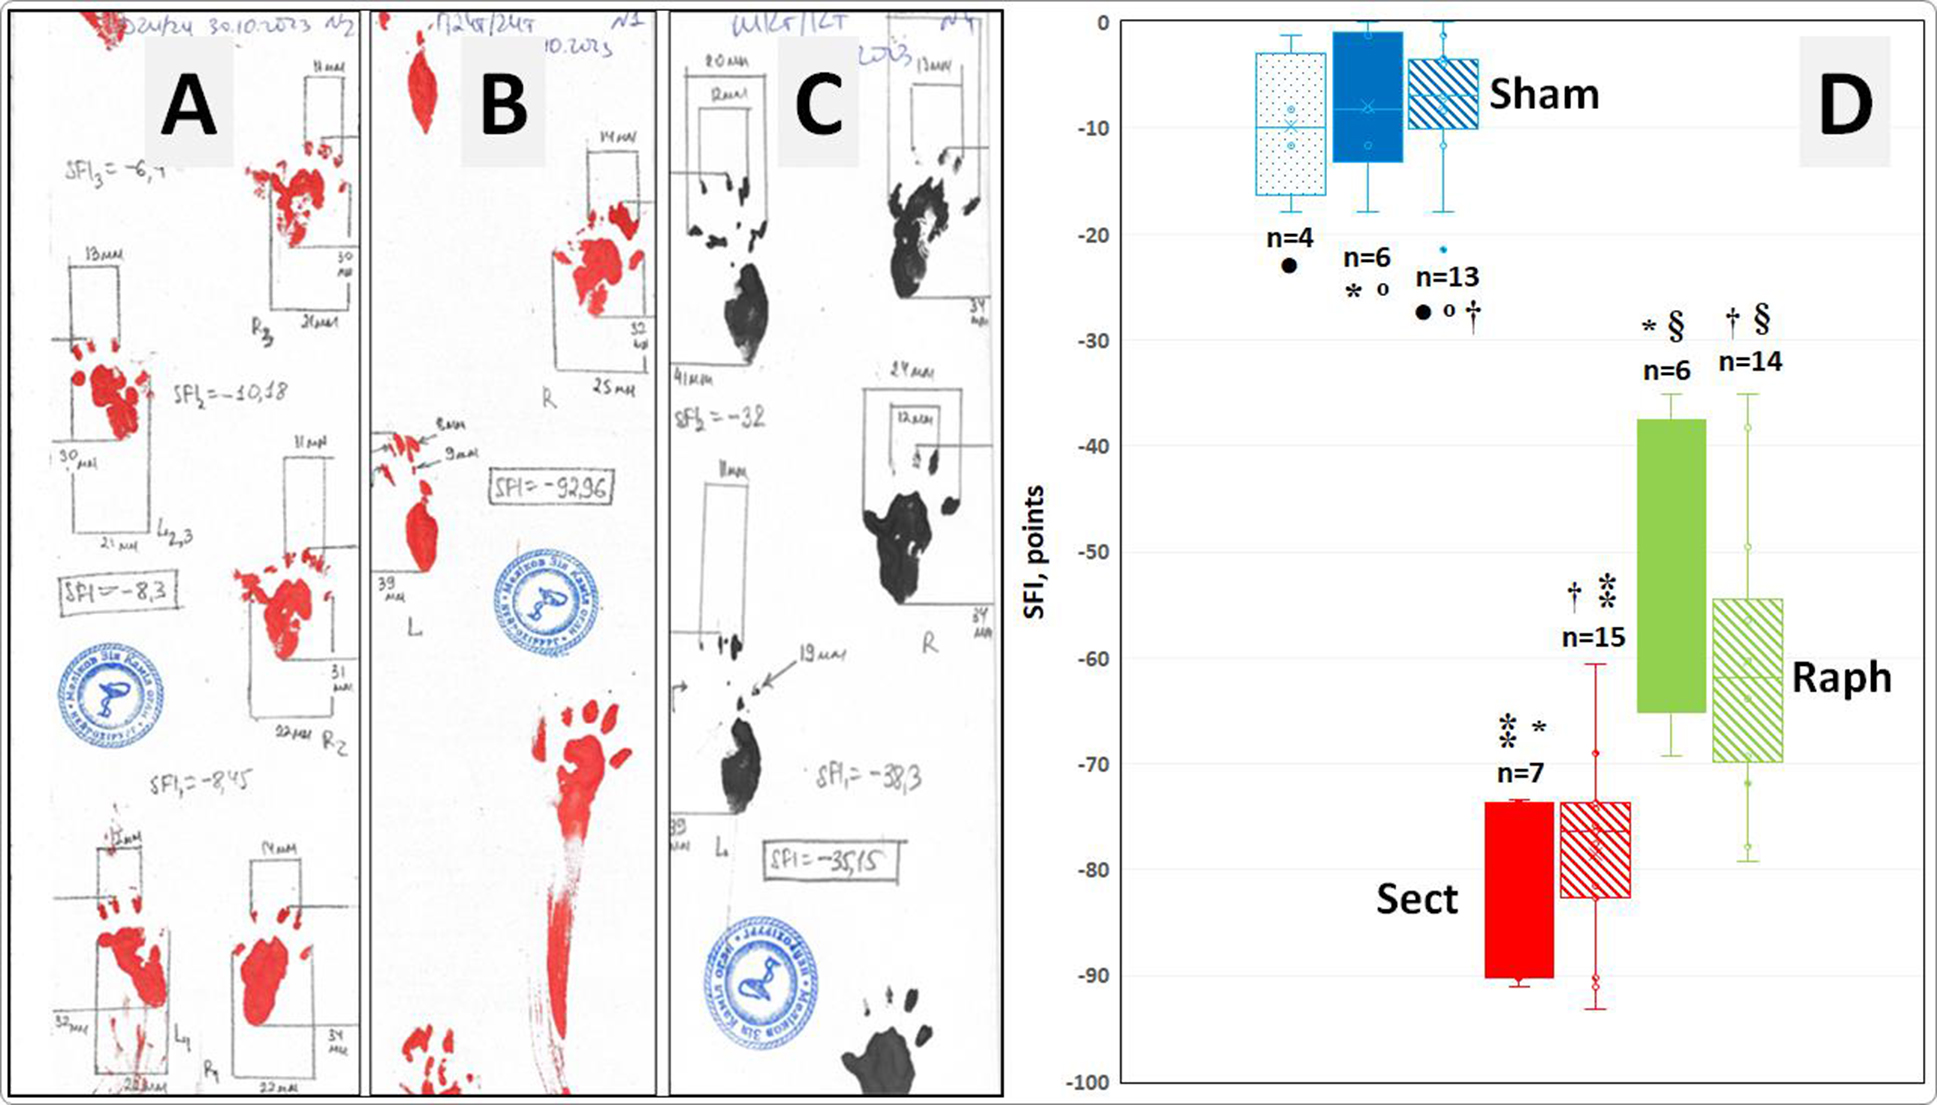
Fig. 1. Examples of footprints and the measurement of their geometric parameters for calculating the sciatic functional index (SFI) in animals from the Sham (A), Sect (B), and Raph (C) groups and subgroups. D - actual SFI values (points), their medians (horizontal lines within the rectangles), interquartile range boundaries (lower and upper sections of the rectangles corresponding to the first and third quartiles, respectively), mean values (x), standard deviations (distance between the mean value marker and the lower or upper edge of each rectangle), and dispersion beyond the upper and lower quartiles (horizontal bars of the vertical whiskers) in the subgroups analyzed in this study (Sham ‒ n = 6 and n = 4; Sect ‒ n = 7; Raph ‒ n = 6), as well as in the corresponding overall groups (Sham ‒ n = 13; Sect ‒ n = 15; Raph ‒ n = 14) investigated in the previous study [49].
Notes:
* Statistically significant differences in SFI values in pairwise subgroup comparisons (p < 0.001, ANOVA test and Tukey’s post-hoc comparisons).;
† Statistically significant differences in SFI values when comparing overall groups (p < 0.001, Kruskal–Wallis test and Steel–Dwass post-hoc comparisons);
º , ● , ⁑ , § ‒ Differences in SFI values in comparisons between an overall group and its corresponding subgroup are statistically non-significant (p > 0.05, Student’s t-test for independent samples).
Electroneuromyographic Examination
Electroneuromyographic (ENMG) assessment was performed on all animals from all study groups 12 weeks after injury modeling, immediately after obtaining data for determining the SFI. Anesthesia was induced via intraperitoneal injection of 1% thiopental sodium solution (10 mg/mL) ("Kyivmedpreparat", Ukraine), with additional intraperitoneal administration of ketamine and xylazine when necessary (as previously described) due to premature reduction of anesthesia depth. The sciatic nerve was freed from scar tissue through the same surgical approach. A grounding electrode, moistened with 0.9% sodium chloride solution, was placed under the animal’s abdomen. Proximally to the injury site, the nerve was enclosed between two contacts of a custom-made stimulating electrode (Fig. 2A, B), avoiding contact with surrounding tissues. Each contact was made from a 5-mL syringe needle with an external diameter of 0.7 mm, a length of 38 mm, and an electrical resistance of up to 0.1 Ohm (Fig. 2A). Stimulation current was generated using a four-channel electromyograph "M-Test" (LLC SPE "DX-SYSTEMS", Kharkiv) in packets of 10 impulses, each lasting 0.2 ms at a magnitude of 6 mA, with a pulse frequency of 1 Hz per packet. A registration electrode, constructed similarly to the stimulation electrode, was inserted into the gastrocnemius muscle (m. triceps surae), compressed between the experimenter’s thumb and index finger, parallel to the main axis of the tibia at the thickest muscle region (Fig. 2B). The distance between the stimulation and registration electrodes was approximately 25 mm. Impulses were recorded and processed using the electromyograph with the "M-Test" software package (LLC SPE "DX-SYSTEMS", Kharkiv).
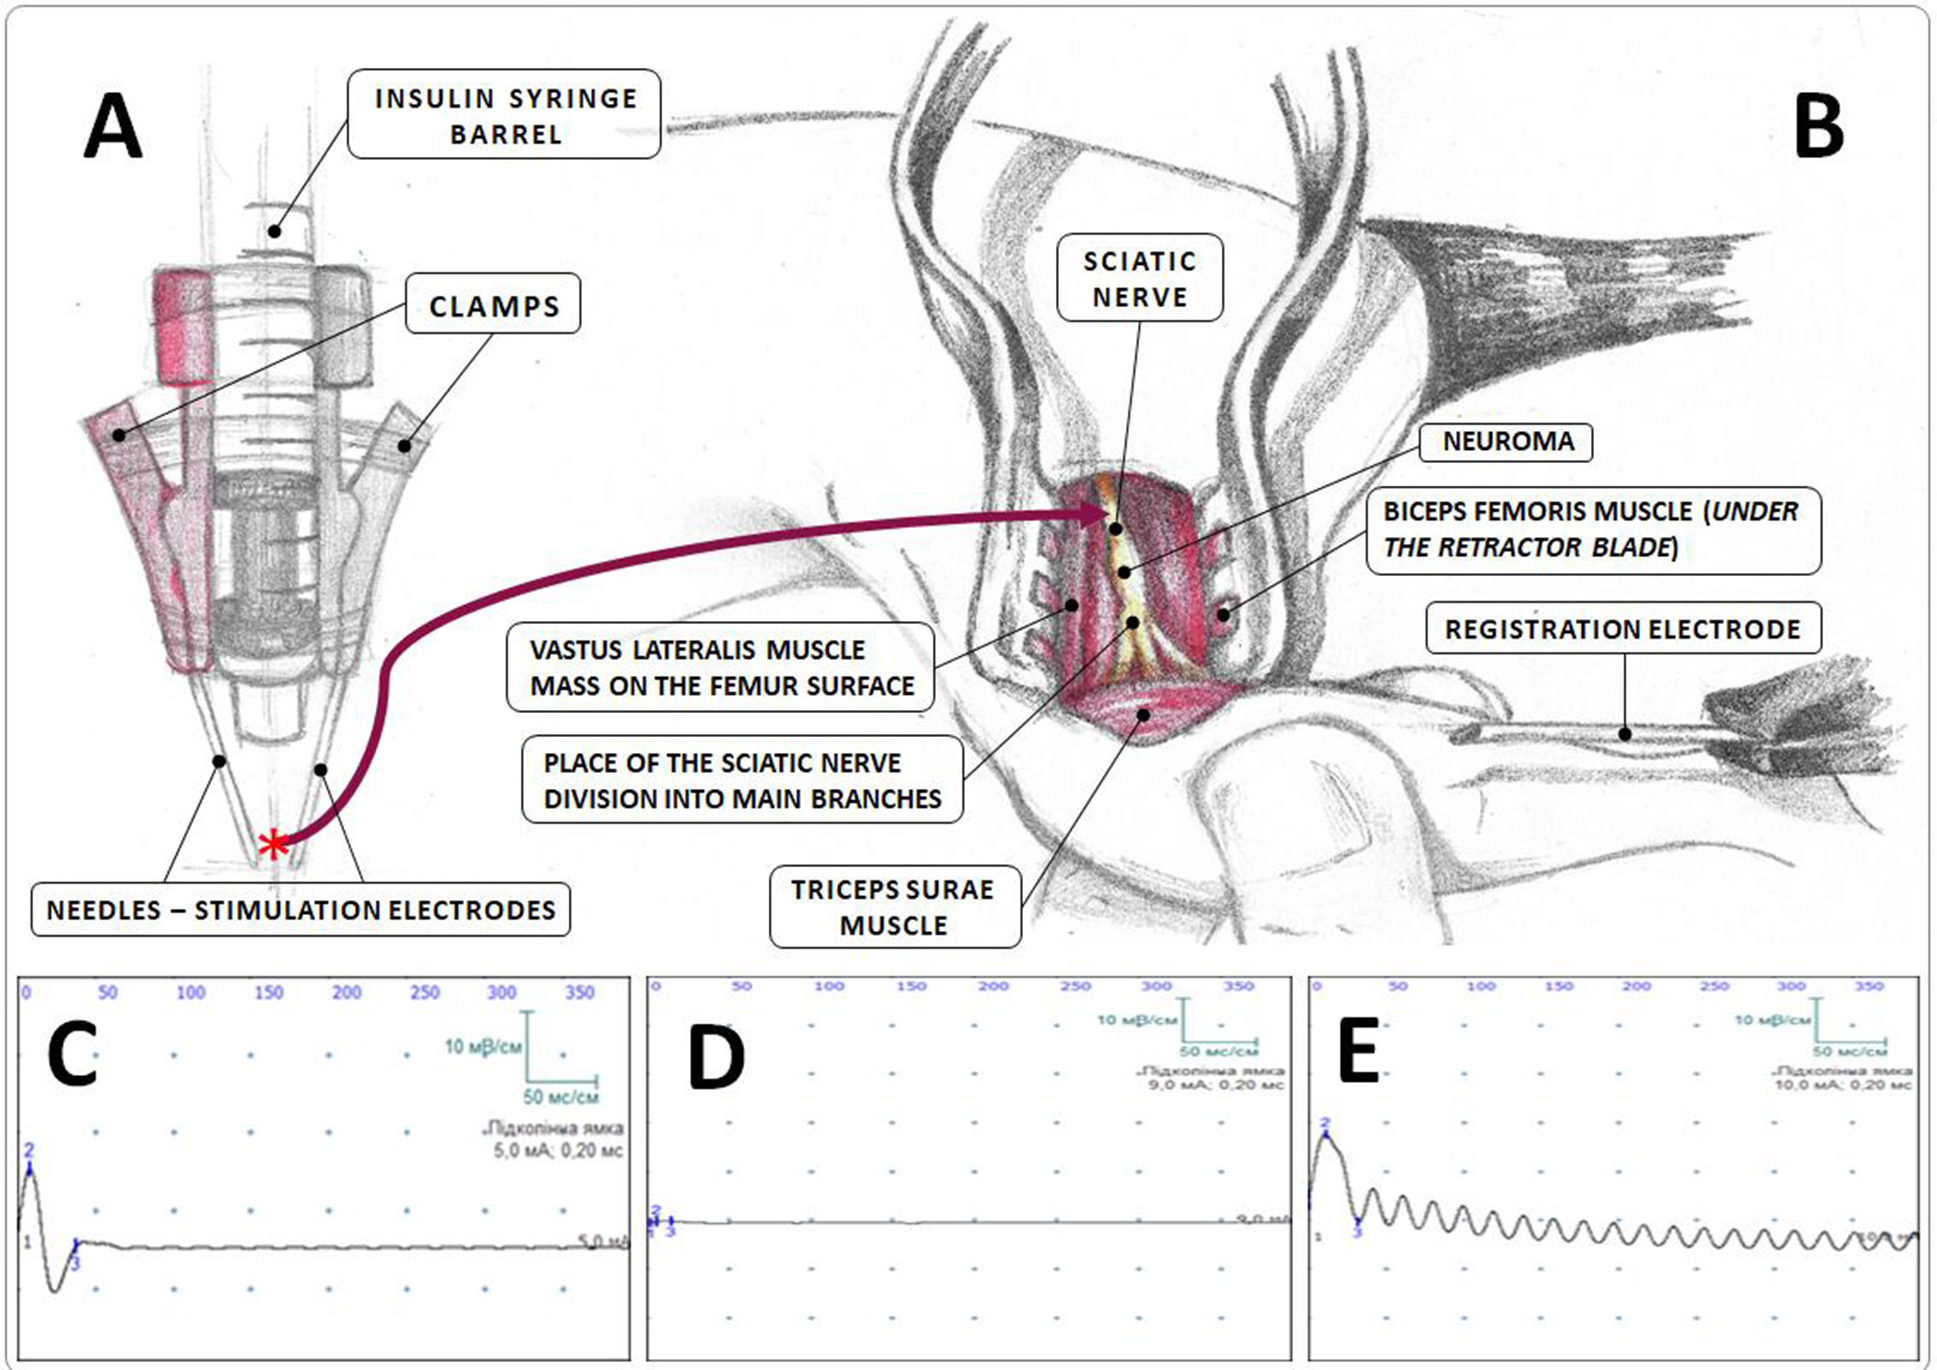
Fig. 2. Electroneuromyographic study (schematic representation):
A — construction of the stimulation electrode; B — area of electroneuromyography implementation; C–E — examples of electroneuromyograms in the Sham (C), Sect (D), and Raph (E) groups;
* the site of sciatic nerve trunk capture by the needle of the stimulation electrode.
Two parameters were evaluated: 1) amplitude of the M-response (mV) – the absolute difference between the peak negative and peak positive values of the recorded electrical potential (M-response) during gastrocnemius muscle excitation induced by sciatic nerve stimulation; 2) latency period of the M-response (ms) – the time from the moment of sciatic nerve electrical stimulation to the initial negative deviation of the recorded electrical potential in the gastrocnemius muscle.
In Vivo Fixation of biological material, withdrawal of animals from the experiment, and subsequent material fixation
Immediately after the completion of electroneuromyography, the animal, under deep anesthesia, was secured in a supine position on the operating table. The thoracic cavity was widely opened to expose the heart apex, which was perforated with a needle connected to a reservoir containing cooled physiological saline. The reservoir was positioned at a height sufficient to create the necessary infusion pressure. Blood was expelled from the circulatory system through a perforation in the right atrial wall. While the heart was still beating, the circulatory system was perfused with cooled physiological saline (~50 mL), followed by a 4% paraformaldehyde solution (~50 mL), until fibrillation of the limb, trunk, and tail muscles was observed. The paraformaldehyde solution was freshly prepared (ex tempore) from a 37% formalin solution (“Inter-Synthesis”, Ukraine) and distilled water in the required volume.
In animals whose tissues were pre-fixed using this method, the sciatic nerve, including the injury site (for rats in the Sham and Raph groups), or segments of both nerve stumps, each 0.5–1.0 cm in length (for the Sect group), was excised. The distal segment in the Sect group exhibited severe atrophy, appearing semi-transparent and often containing multiple closely adjacent nerve trunks. The excised samples were placed in a 4% paraformaldehyde solution for 5–7 days, followed by washing in phosphate-buffered saline for 1–2 days. After removal of residual surrounding tissues, the nerve samples were transferred to a 10% neutral paraformaldehyde solution for histopathological examination. The phosphate-buffered saline was prepared by dissolving one tablet of a concentrated dried reagent of a similar chemical composition (Phosphate buffered saline; Sigma-Aldrich, USA) in 200 mL of distilled water. Throughout the post-excision and primary fixation period, all samples were stored at a temperature of 0 to +5 °C.
Pathomorphological examination of the sciatic nerve was conducted on 4 animals from the Sham group, 7 from the Sect group, and 6 from the Raph group. Sciatic nerve samples obtained from the Sect and Raph groups were acutely segmented into three fragments: central (Sect group) or regenerative neuroma (Raph group), proximal, and distal (Sect and Raph groups). In the Sham group, the fixed nerve trunk was not divided into fragments for obvious reasons. Typically, the proximal fragment in the Sect and Raph groups represented an intact trunk, while the distal fragment contained the initial sections of the common peroneal and tibial nerves, which were closely positioned. In the Sect group, the central fragment exhibited poor development, leading to the presence of a diastasis between the proximal and distal segments.
Not all fixed samples were selected for further analysis (see below). During histological processing, the material was placed on the surface of the metal working block of a microtome-cryostat (MK-25, USSR), frozen to approximately –20 °C, and sectioned into longitudinal slices with a thickness of 20 µm. These sections were then immersed in room-temperature tap water. The selected sections were carefully transferred using a glass hook into a 1% acidic formalin solution for storage. After approximately 24 hours, the sections were placed in an organic solvent (pyridine) for one day, followed by three washes in tap water (~10 min each) and three additional washes in distilled water (~5 min each). Subsequently, the sections were transferred into a 30% silver nitrate solution for 24 hours. The next day, the sections were briefly (less than 1 min) immersed in distilled water, then subjected to three washes (~4 min each) in a 1% acidic formalin solution. This was followed by ~2 min immersion in a freshly prepared ammoniacal silver solution. The sections were then placed in a 1% acidic formalin solution until they developed a brown coloration, after which they were treated for 15–20 s in a 0.5% acidic formalin solution containing ~1–2% glucose, followed by ~30 s in a weak ammonia solution and ~10–15 min in distilled water. Subsequently, the sections were immersed in a 99.8% isopropyl alcohol solution for several minutes and then mounted onto glass slides. After drying, 1–2 drops of Canada balsam were applied, and the sections were covered with a thin cover glass. Photodocumentation was performed no earlier than 24 hours post-processing using an Olympus BX51 microscope equipped with an Olympus C3040ZOOM digital camera and Olympus DP-Soft 3.2 software (Olympus, Tokyo, Japan). The micrographs, captured at 200× magnification, had a calculated height of 440 µm with a digital resolution of 2272×1704 pixels. For each of the three nerve segments, at least six micrographs were obtained, typically from different longitudinal sections of the same segment. The digital image height was measured using ImageJ software (Wayne Rasband, USA). A perpendicular line was drawn across the main nerve axis, and the number of nerve fibers intersecting this line was counted. This procedure was repeated multiple times, shifting the line along the nerve’s main axis within the micrograph. In the neuroma region, the number of measurements was increased to 5–6 for greater accuracy. The obtained fiber count values from each measurement were used to construct variability series for statistical analysis. The results were expressed as the nerve fiber density – the number of fibers calculated per 440 microns of actual length of the aforementioned imaginary line perpendicular to the main nerve axis.
Statistical data analysis
Statistical analysis of the quantitative data was performed using the EZR (R-STATISTICS) software package. If the distribution of the studied parameter in the samples did not deviate from normality, the mean level was presented as M±SD, where M represents the arithmetic mean and SD denotes the standard deviation. In cases where the distribution deviated from normality, the median and interquartile range were reported as Me (QI-QIII), where Me is the median, and QI-QIII represent the first and third quartiles, respectively. The Shapiro–Wilk test was used to assess the normality of the data distribution. If at least one of the compared samples exhibited a non-normal distribution of individual values, the Kruskal–Wallis test was applied to determine the significance of differences between groups, with post hoc comparisons conducted using the Steel–Dwass test. If the data were normally distributed, the homogeneity (equality) of variances among the samples was assessed using Bartlett’s test. If variance distributions deviated from normality, comparisons were made using the Kruskal–Wallis test combined with the Steel–Dwass test for post hoc analysis. In cases where variance distribution was normal, analysis of variance (ANOVA) was employed, followed by Tukey’s test for post hoc comparisons.
To determine the significance of differences in SFI values between the analyzed samples and overall groups at the corresponding observation time points [49], Student’s t-test for independent samples was used.
The significance of correlation between individual SFI values, amplitude and the latency of M-response and nerve fiber density across all groups was evaluated using Spearman’s rank correlation test (if the distribution of values for both studied variables differed from normal) or using Pearson’s criterion (if at least one of the variables followed a normal distribution).
In all cases, the assumptions regarding the statistical significance of the obtained result were considered correct if the probability of the opposite assumption was less than 0.05 (p<0.05).
Results
Sciatic Functional Index (SFI)
According to previous data [49], the mean SFI value at 12 weeks post-injury was –7.6±6.3 points in the overall Sham group (n=13), –78.5±8.6 points in the overall Sect group (n=15), and –60.4±13.0 points in the overall Raph group. Statistically significant differences were identified for all three pairwise comparisons between the overall groups: Sham vs. Sect, Sham vs. Raph, and Sect vs. Raph [49] (Table 1, Fig. 1).
In the specific subgroups analyzed in this study, the SFI values were –7.9±6.7 points in the Sham subgroup, –80.6±7.5 points in the Sect subgroup, and –52.1±13.7 points in the Raph subgroup (see Table 1, Fig. 1). The SFI values for each subgroup did not differ significantly from their corresponding overall experimental groups. As in the case of the overall groups, SFI values in the examined subgroups showed significant differences in all pairwise comparisons (see Table 1). These findings confirm the representativeness of the analyzed subgroups, at least in terms of the functional-anatomical parameter SFI.
Table 1. Mean SFI values in the overall experimental groups [49] and the analyzed subgroups (M ± SD)
|
Animal population |
Experimental animal populations |
||
|
Sham |
Sect |
Raph |
|
|
Analyzed subgroups |
n=6; |
n=7; |
n=6; |
|
Overall groups [49] |
n=13; |
n=15; |
n=14; |
Notes:
* The difference in SFI values is statistically significant (p < 0.001, ANOVA test and Tukey’s post-hoc comparisons);
† The difference in SFI values is statistically significant (p < 0.001, Kruskal–Wallis test and Steel–Dwass post-hoc comparisons);
º , 1 , 2 Differences in SFI values are statistically non-significant (p > 0.05, Student's t-test for independent samples).
Amplitude and latency of the M-Response
In the Sham subgroup, the mean amplitude of the M-response was 9.5 (8.2; 9.5) mV, while the mean latency was 0.9 ± 0.1 ms (Table 2, Fig. 3). In the Sect subgroup, these values were 0.3 (0.3; 0.4) mV and 3.9 ± 3.1 ms, respectively. In the Raph subgroup, the amplitude was 4.4 (3.7; 4.9) mV, with a latency of 3.3 ± 1.7 ms. Statistically significant differences in M-response amplitude were observed across all pairwise subgroup comparisons (Sham vs. Sect, Sham vs. Raph, and Sect vs. Raph). The latency of the M-response differed significantly only in comparisons between the Sham and Sect subgroups and between the Sham and Raph subgroups.
Table 2. Mean values of M-response amplitude (mV) and latency (ms) in experimental subgroups
|
Experimental subgroups |
|||||
|
Sham (n=6) |
Sect (n=7) |
Raph (n=6) |
|||
|
M-response amplitude, Me (QI-QIII) |
M-response latency, |
M-response amplitude, Me (QI-QIII) |
M-response latency, |
M-response amplitude, |
M-response latency, |
|
9,5 (8,2; 9,5) * † |
0,9±0,1 X, Y |
0,3 (0,3; 0,4) * º |
3,9±3,1 X |
4,4 (3,7; 4,9) † º |
3,3±1,7 Y |
Notes:
* The difference in M-response amplitude between the Sham and Sect subgroups is statistically significant (p < 0.01, Steel–Dwass post-hoc test);
† The difference in M-response amplitude between the Sham and Raph subgroups is statistically significant (p < 0.05, Steel–Dwass post-hoc test);
º The difference in M-response amplitude between the Sect and Raph subgroups is statistically significant (p < 0.01, Steel–Dwass post-hoc test);
X The difference in M-response latency between the Sham and Sect subgroups is statistically significant (p < 0.01, Steel–Dwass post-hoc test);
Y The difference in M-response latency between the Sham and Raph subgroups is statistically significant (p < 0.05, Steel–Dwass post-hoc test).
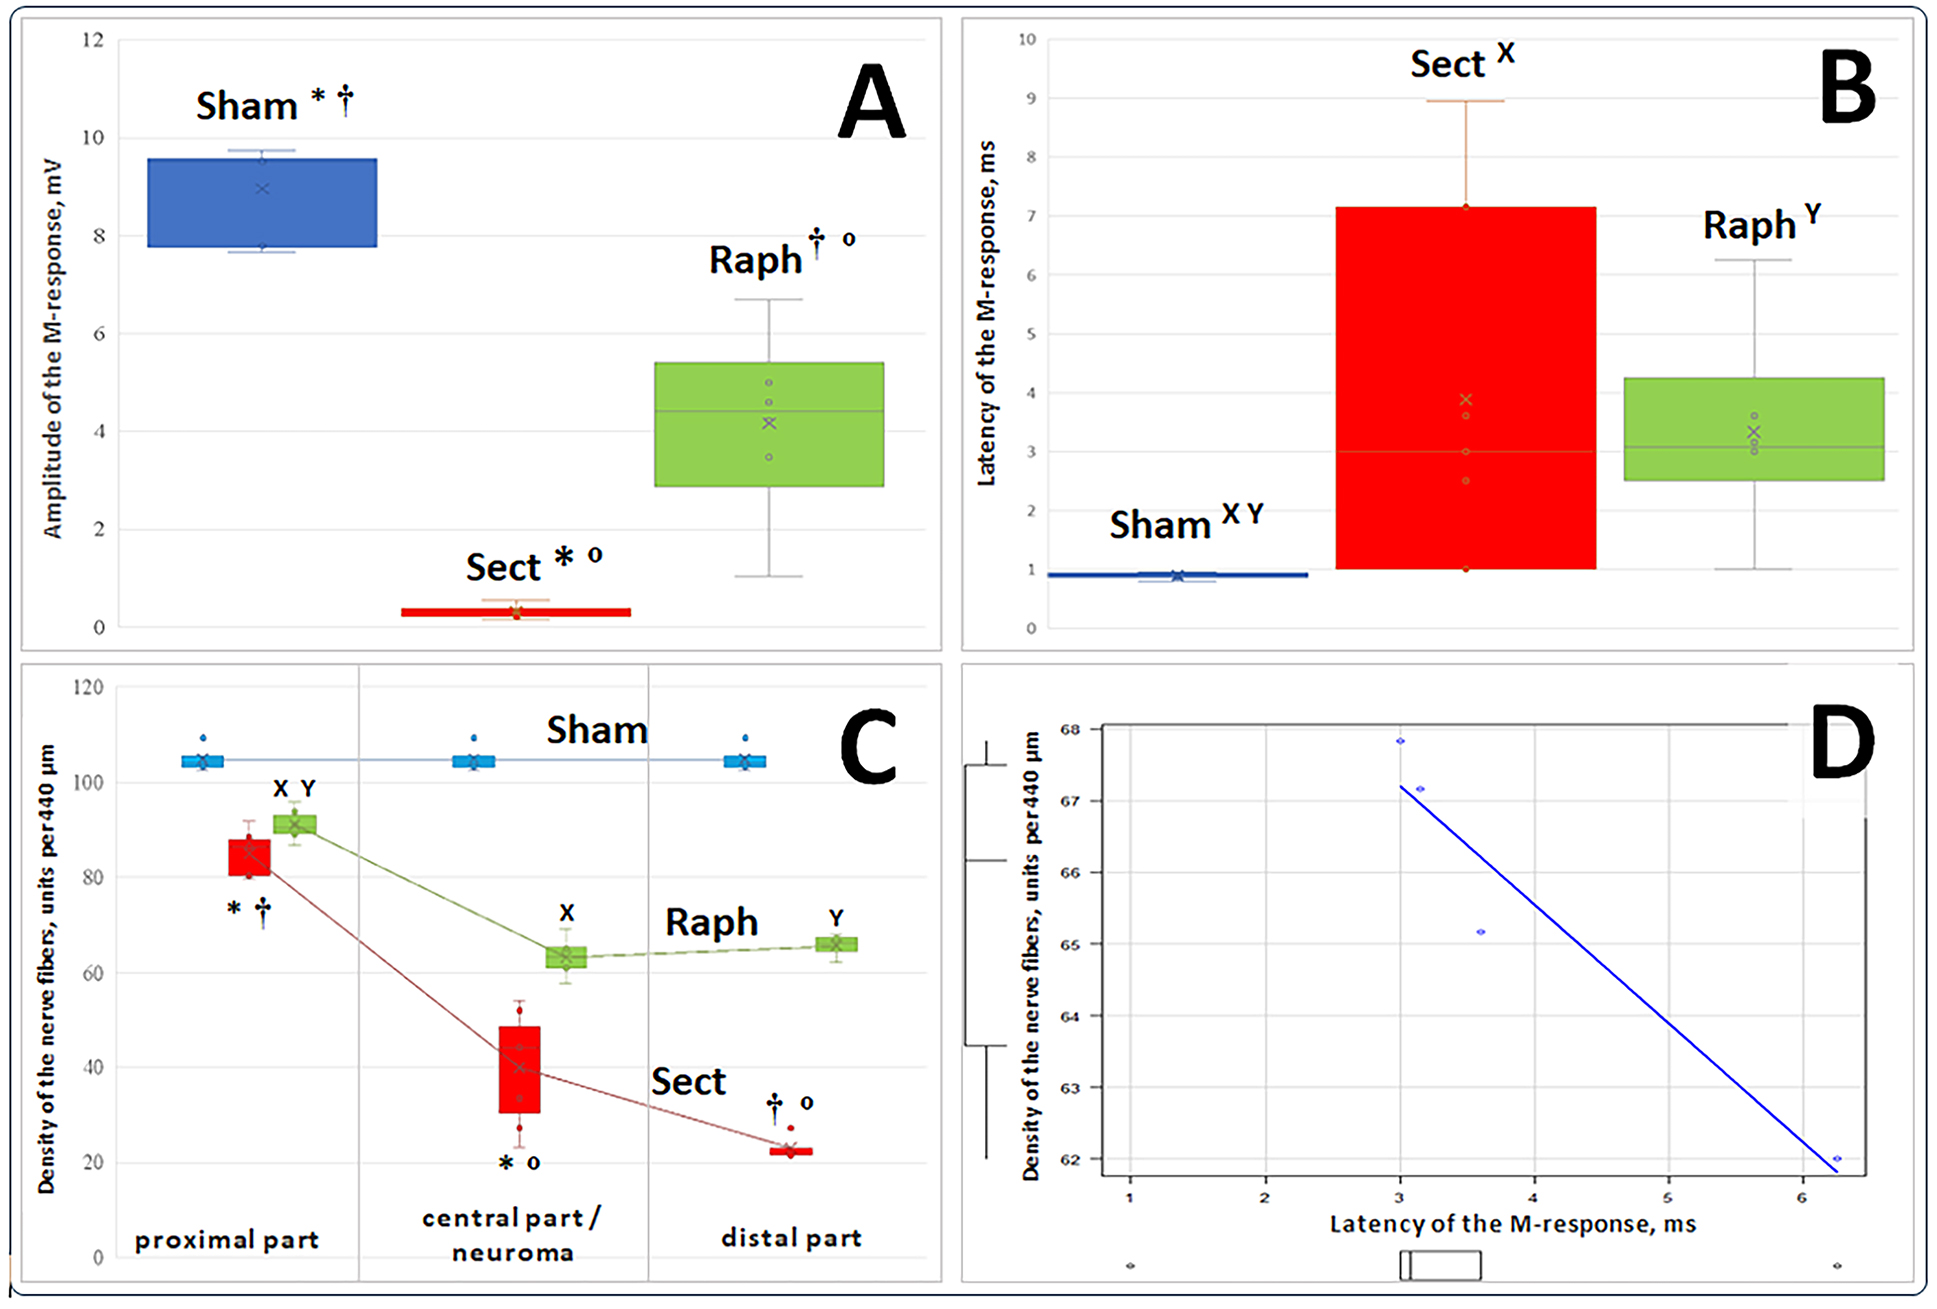
Fig. 3. Actual values (points) of M-response amplitude (mV, A), latent period (ms, B), nerve fiber density (units/440 µm, C), their medians (horizontal lines within vertical rectangles), interquartile range boundaries (lower and upper parts of the rectangles corresponding to the first and third quartiles at each time point, respectively), mean values (x), standard deviations (distance between the mean value mark and the lower or upper edge of each rectangle), and dispersion (variance) beyond the upper and lower quartiles (horizontal bars of the vertical whiskers) for three sample groups. D represents a significant strong negative correlation between individual values of the M-response latent period and nerve fiber density in the distal portion of the resected sciatic nerve trunk in the Raph sample (r = –0.96, 95% confidence interval –1.00…–0.01, p < 0.05).
Notes:
Regarding block A (M-response amplitude):
* The difference in values between the Sham and Sect groups is statistically significant (p < 0.01, Steel-Dwass test for post hoc comparisons).
† The difference in values between the Sham and Raph groups is statistically significant (p<0.05, Steel-Dwass test for post hoc comparisons).
º The difference in values between the Sect and Raph groups is statistically significant (p < 0.01, Steel-Dwass test for post hoc comparisons).
Regarding Block B (M-response latent period):
X The difference in values between the Sham and Sect groups is statistically significant (p < 0.01, Steel-Dwass test for post hoc comparisons).
Y The difference in values between the Sham and Raph groups is statistically significant (p < 0.05, Steel-Dwass test for post hoc comparisons).
Regarding Block C (nerve fiber density; results for three parts of the nerve in each group are connected by a conditional line; in the Sham group, for obvious reasons, the same nerve segment was used for all three measurements):
* The difference between the nerve fiber density values in the proximal and central parts of the nerve in the Sect group is statistically significant (p < 0.01, Steel-Dwass test for post hoc comparisons).
† The difference between the nerve fiber density values in the proximal and distal parts of the nerve in the Sect group is statistically significant (p < 0.05, Steel-Dwass test for post hoc comparisons).
º The difference between the nerve fiber density values in the central and distal parts of the nerve in the Sect group is statistically significant (p < 0.05, Steel-Dwass test for post hoc comparisons).
X The difference between the nerve fiber density values in the proximal part of the nerve and the neuroma in the Raph group is statistically significant (p < 0.001, Tukey's test for post hoc comparisons).
Y The difference between the nerve fiber density values in the proximal and distal parts of the nerve in the Raph group is statistically significant (p < 0.001, Tukey's test for post hoc comparisons).
The nerve fiber density
A macroscopic histological examination revealed qualitative visual differences in the spatial density, course, and mutual arrangement of myelinated nerve fibers in the studied segments of the sciatic nerve among animals from different experimental groups (Fig. 4).
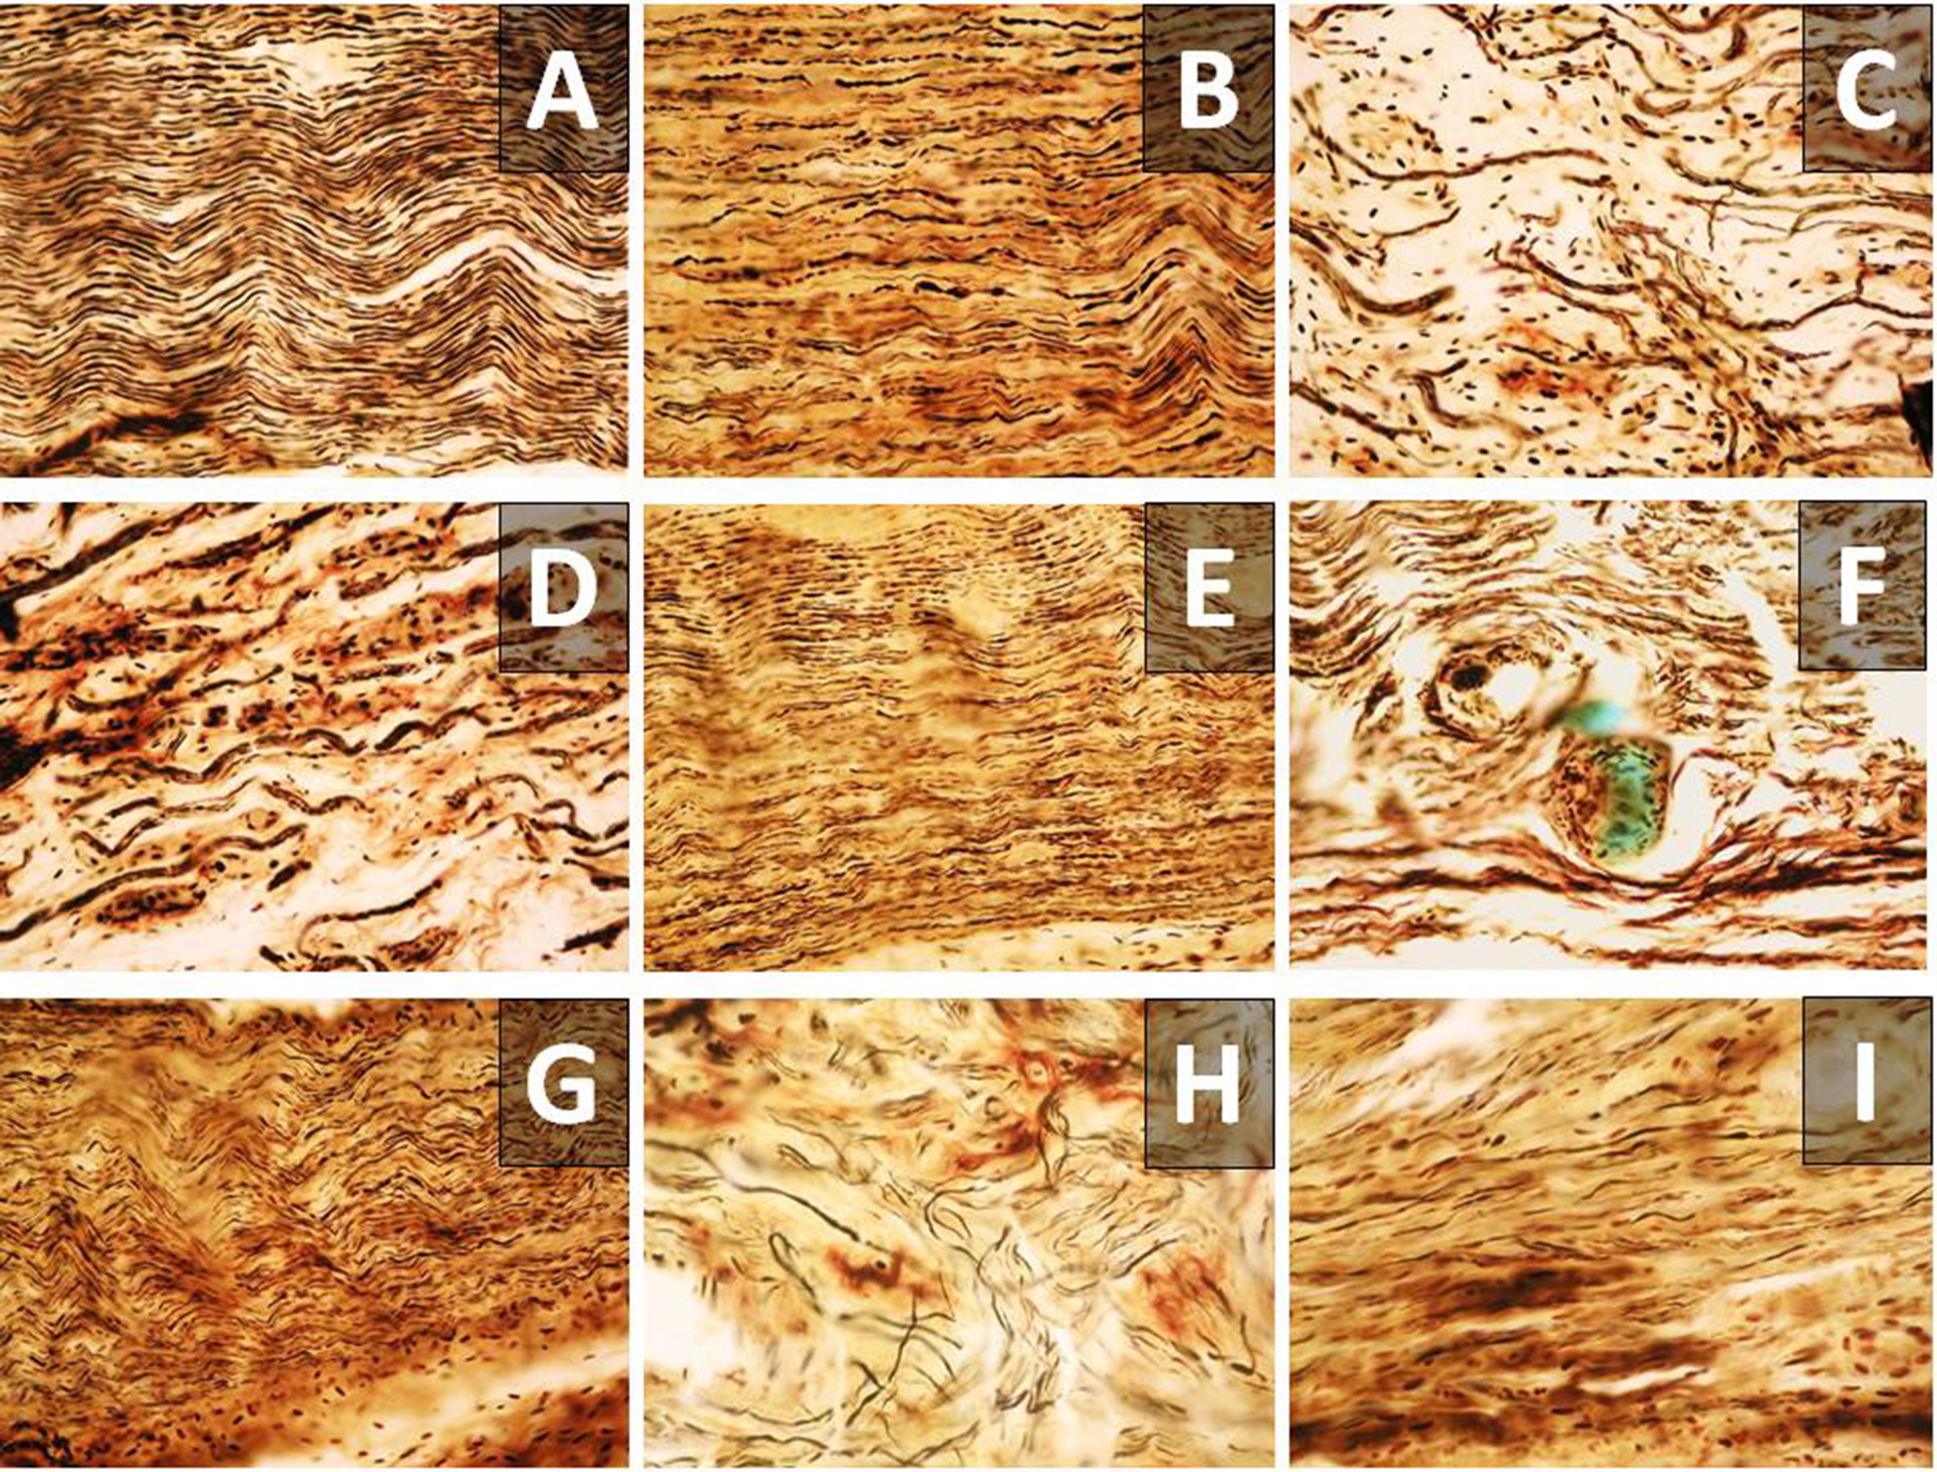
Fig. 4. Tissue structure of the examined region of the sciatic nerve in the Sham (A), Sect (B – proximal part; C, H – central part; D – distal part), and Raph (E – proximal part; F, I – neuroma; G – distal part) groups. A–G – ×200; H, I – ×400.
The SFI values of the Sham sample (n = 4), used for determining nerve fiber density, exhibited sciatic function index (SFI) values that did not significantly differ from those of the overall Sham group (n = 13) [49] (p = 0.56, Student’s t-test for independent samples) (Fig. 1D), with a mean–9.8 ± 6.9 points. The nerve fiber density in this sample was 104.9 ± 3.1 units/440 µm (Table 3).
In the Sect group (n = 7), the nerve fiber density in the proximal part of the nerve (n = 7) was 86.5 80.4; 87.9 units/440 µm, in the central part (n = 7) – 44.2 (30.4; 48.7) units/440 µm, and in the distal part (n = 4) – 21.6 (21.5; 23.1) units/440 µm. These values differed significantly (Table 3).
Table 3. The nerve fiber density (units/440 µm) in the proximal, central, and distal parts of the nerve
|
Experimental sample |
Examined nerve fragment |
||
|
Proximal part |
Central part/ neuroma |
Distal part |
|
|
Sham |
Mean±SD, n=4 |
||
|
104,9±3,1 |
|||
|
Sect |
Me (QI-QIII), n=7 |
Me (QI-QIII), n=7 |
Me (QI-QIII), n=4 |
|
86,5 (80,4; 87,9) * † |
44,2 (30,4; 48,7) * º |
21,6 (21,5; 23,1) † º |
|
|
Raph |
Mean±SD, n=6 |
Mean±SD, n=6 |
Mean±SD, n=4 |
|
91,1±3,3 X, Y |
63,2±4,1 X |
65,5±2,6 Y |
|
Notes:
* Statistically significant difference in the nerve fiber density values between the proximal and central part of the nerve in the Sect sample (p < 0.01, Steel-Dwass test for post hoc comparisons).
† Statistically significant difference in the nerve fiber density values between the proximal and distal part of the nerve in the Sect sample (p < 0.05, Steel-Dwass test for post hoc comparisons).
º Statistically significant difference in the nerve fiber density values between the central and distal part of the nerve in the Sect sample (p < 0.05, Steel-Dwass test for post hoc comparisons).
X Statistically significant difference in the nerve fiber density values between the proximal part of the nerve and neuroma in the Raph sample (p < 0.001, Tukey’s test for post hoc comparisons).
Y Statistically significant difference in the nerve fiber density values between the proximal and distal part of the nerve in the Raph sample (p < 0.001, Tukey’s test for post hoc comparisons).
In the Raph group (n = 6), the mean nerve fiber density in the proximal part of the nerve (n = 6) was 91.1 ± 3.3 units/440 µm, in the neuroma region (n = 6) – 63.2 ± 4.1 units/440 µm, and in the distal part of the nerve (n = 4) – 65.5 ± 2.6 units/440 µm. Statistically significant differences within this group were observed only when comparing the proximal part with the neuroma and the proximal with the distal part (p < 0.001, Tukey’s test for post hoc comparisons; Table 3).
When comparing the values of the nerve fiber density between different groups, statistically significant differences were observed for all nerve segments (Table 4). Due to the limited sample size for each sample (n = 4), a statistically significant difference in the distal nerve segment was only detected when using the Wilcoxon-Mann-Whitney test (Table 4).
Table 4. Intergroup differences in the density of nerve fibers (units/440 µm) in the examined nerve fragments
|
Experimental sample |
Examined nerve fragment |
||
|
Proximal part, |
Central part/ neuroma, |
Distal part, |
|
|
Sham |
n=4 |
||
|
103,8 (103,1; 105,6) X, Y, 1, 2 АБО 104,9±3,1 * † |
|||
|
Sect |
n=7 |
n=7 |
n=4 |
|
84,9±4,7 * º |
44,2 (30,4; 48,7) X, Z |
21,6 (21,5; 23,1) 1, 3 |
|
|
Raph |
n=6 |
n=6 |
n=4 |
|
91,1±3,3 † º |
63,1 (60,9; 65,2) Y, Z |
66,2 (64,4; 67,3) 2, 3 |
|
Notes.
For the proximal part of the nerve:
* A statistically significant difference in nerve fiber density values between the Sham and Sect samples (p<0.001, Tukey’s post-hoc test);
† A statistically significant difference in nerve fiber density values between the Sham and Raph samples (p<0.001, Tukey’s post-hoc test);
º A statistically significant difference in nerve fiber density values between the Sect and Raph samples (p<0.05, Tukey’s post-hoc test).
For the central part of the nerve:
X A statistically significant difference in nerve fiber density values between the Sham and Sect samples (p<0.05, Steel-Dwass post-hoc test);
Y A statistically significant difference in nerve fiber density values between the Sham and Raph samples (p<0.05, Steel-Dwass post-hoc test);
Z A statistically significant difference in nerve fiber density values between the Sect and Raph samples (p<0.01, Steel-Dwass post-hoc test).
For the distal part of the nerve:
1 A statistically significant difference in nerve fiber density values between the Sham and Sect samples (p<0.05, Wilcoxon-Mann-Whitney test);
2 A statistically significant difference in nerve fiber density values between the Sham and Raph samples (p<0.05, Wilcoxon-Mann-Whitney test);
3 A statistically significant difference in nerve fiber density values between the Sect and Raph samples (p<0.05, Wilcoxon-Mann-Whitney test).
Correlation between the values of investigated parameters
Within each of the three experimental groups, no statistically significant correlation was found between individual values of the M-response amplitude and the M-response latency, the Sciatic Functional Index (SFI) and both electrophysiological parameters, the SFI and the density of nerve fibers (in all three examined nerve segments), or the density of nerve fibers in the three examined nerve segments and the M-response latency or amplitude. The only exception was a strong negative correlation identified between the individual values of nerve fiber density in the distal part of the nerve and the M-response latency in the Raph group (Fig. 3D).
When the results of all three groups were pooled into a single cohort, statistically significant correlations were observed (Fig. 5). These included correlations between the individual values of the M-response amplitude and latency, the SFI and the M-response amplitude, the SFI and the M-response latency, as well as between the SFI and the density of nerve fibers in the proximal, central (or neuroma), and distal parts of the nerve. Additionally, significant correlations were found between the M-response amplitude and the nerve fiber density in the proximal, central (or neuroma), and distal parts of the nerve, as well as between the M-response latency and the nerve fiber density in the central part of the nerve (or neuroma).
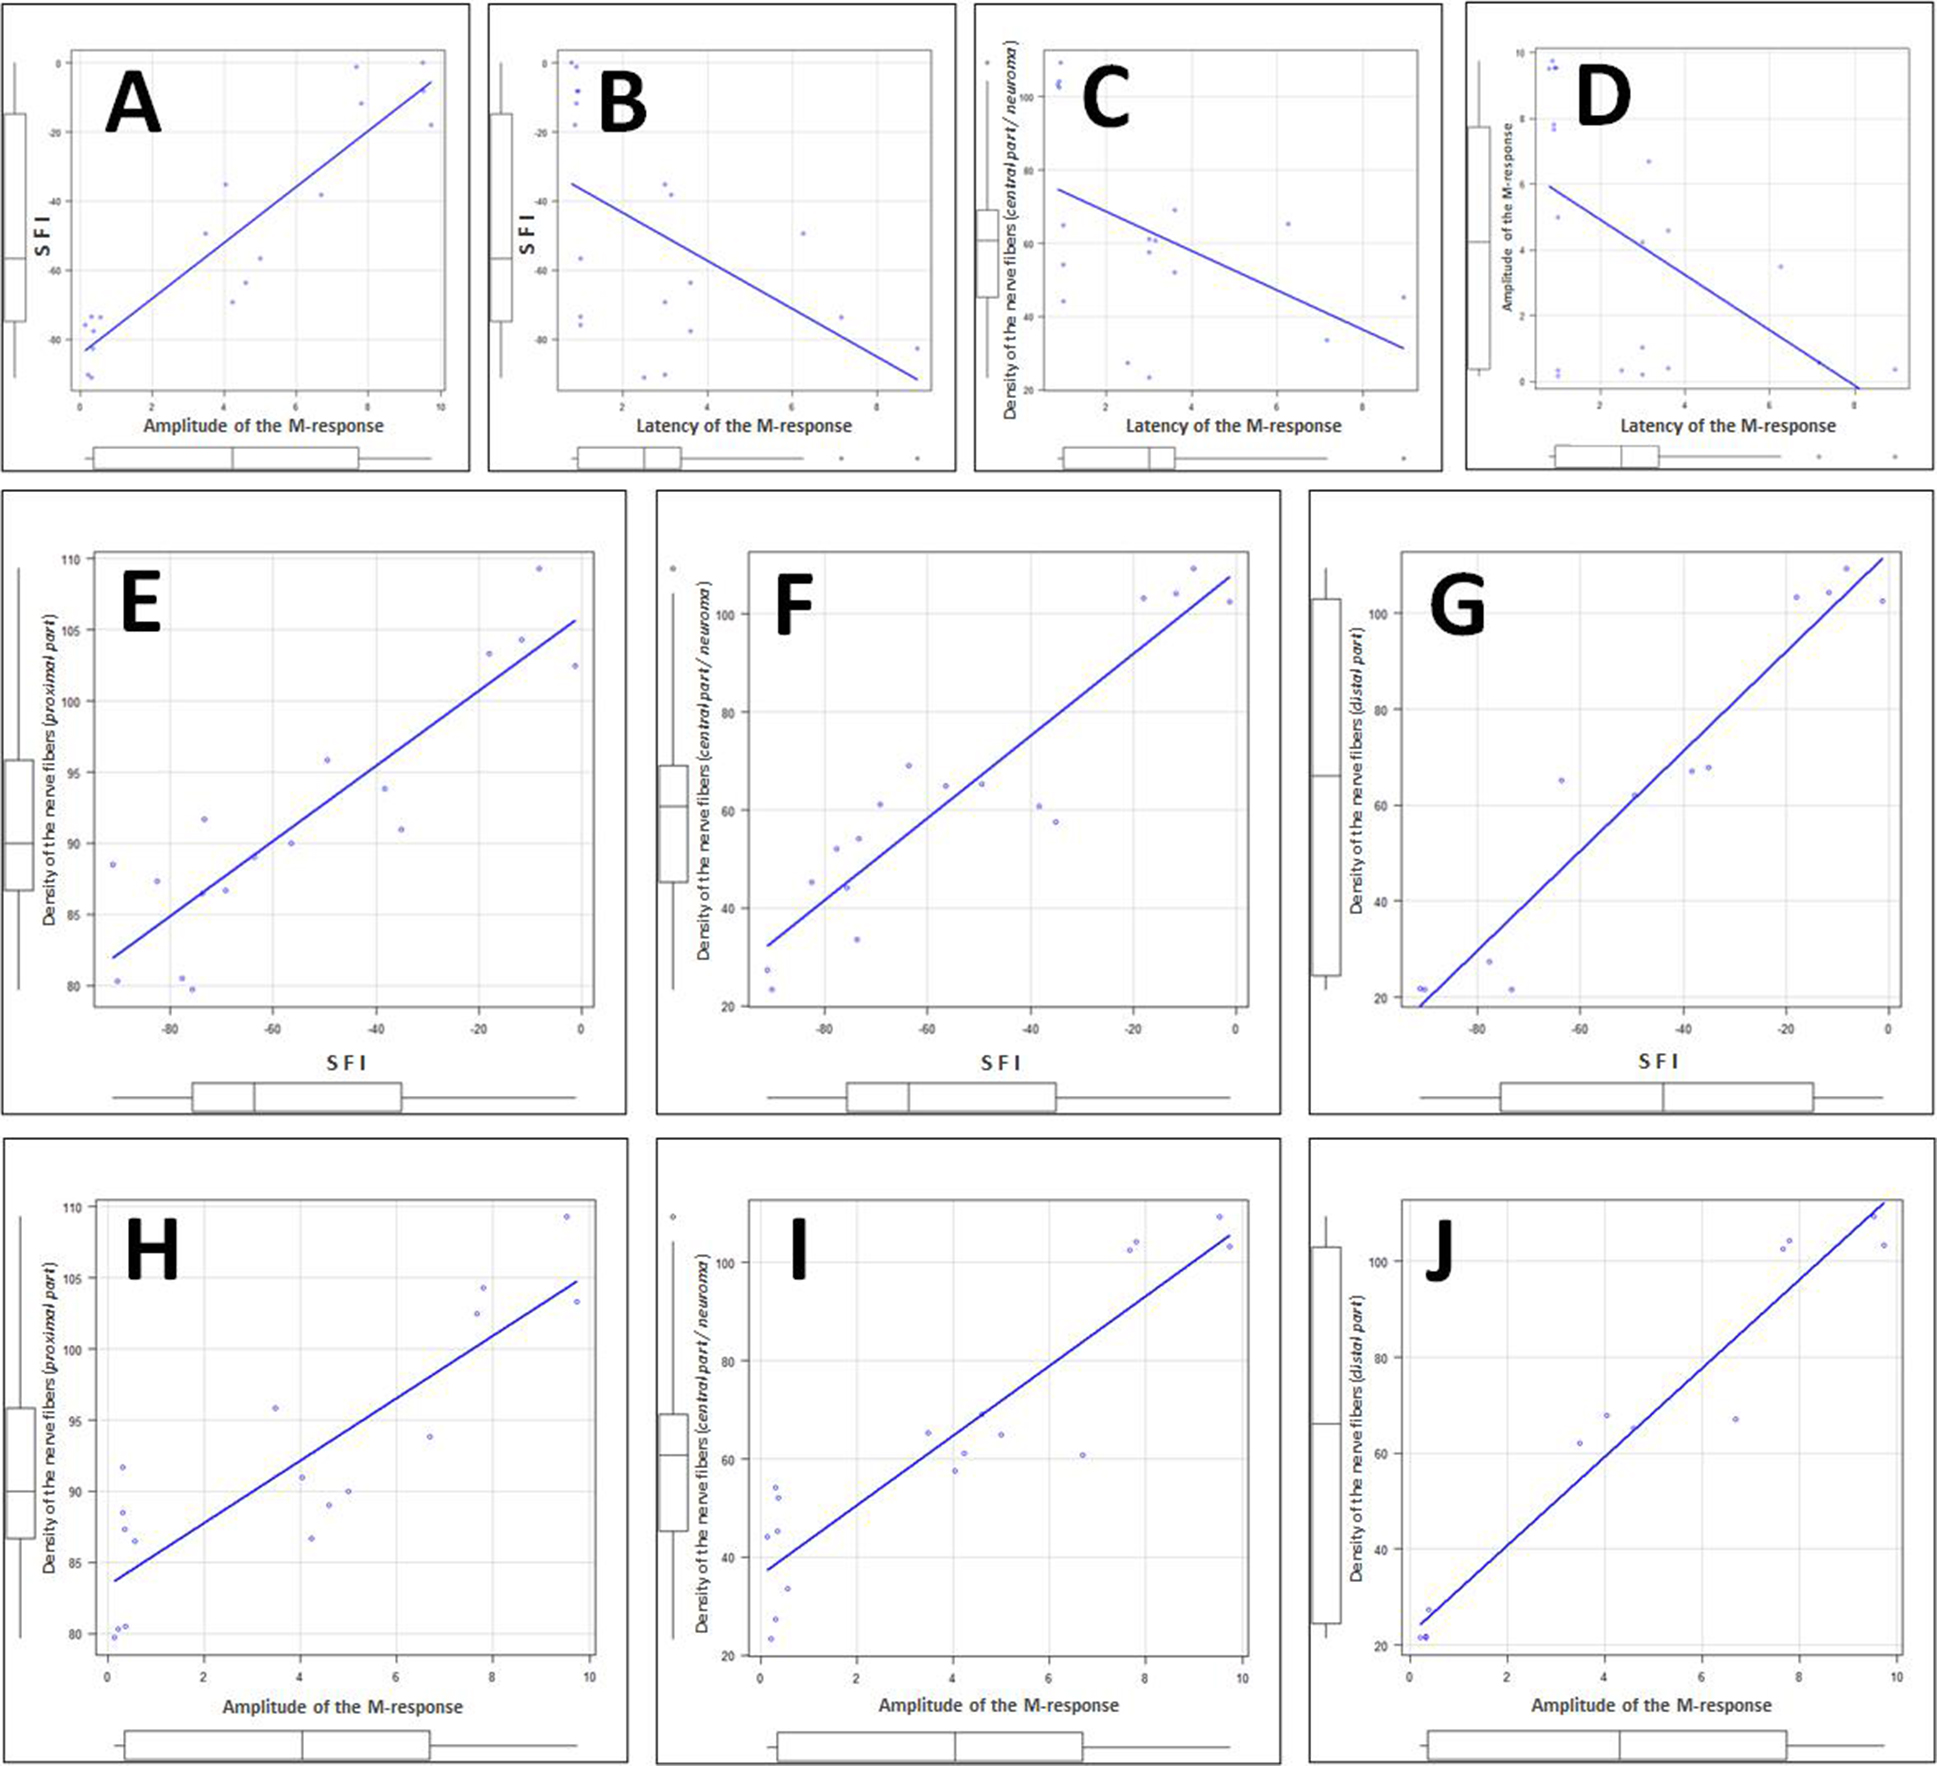
Fig. 5. Examples of statistically significant correlations between individual values of the analyzed parameters (presented in the units used in this article) within the cohort formed from animals of all experimental groups:
A – correlation between individual values of M-response amplitude and SFI (rₛ = +0.88, p < 0.001);
B – correlation between individual values of M-response latency and SFI (rₛ = –0.66, p < 0.01);
C – correlation between individual values of M-response latency and the density of nerve fibers in the central part of the nerve or neuroma (rₛ = –0.50, p < 0.05);
D – correlation between individual values of M-response latency and amplitude (rₛ = –0.57, p < 0.05);
E, F and G – correlations between individual values of SFI and the density of nerve fibers in the proximal part (E, r = 0.90, 95% CI: 0.73–0.96, p < 0.001), central part or neuroma (F, r = 0.92, 95% CI: 0.80–0.97, p < 0.001), and distal part of the nerve (G, r = 0.97, 95% CI: 0.88–0.99, p < 0.001);
H, I and J – correlations between individual values of M-response amplitude and the density of nerve fibers in the proximal part (H, r = 0.87, 95% CI: 0.67–0.95, p < 0.001), central part or neuroma (I, r = 0.92, 95% CI: 0.78–0.97, p < 0.001), and distal part of the nerve (J, r = 0.97, 95% CI: 0.90–0.99, p < 0.001)
Discussion
Peripheral nerve injury (PNI) is a common type of trauma in wartime settings [10, 11], characterized by a complex set of motor dysfunctions, sensory impairments, and chronic pain [1–5]. The effectiveness of PNI treatment remains limited [4, 31]. Promising approaches for its improvement include the development of multi-component bioengineered connectors for the ends of the injured nerve [26, 28, 52–54] and strategies to enhance neuronal network plasticity in the brain [36, 37], particularly through the use of stem cells [26, 55, 56]. The search for and validation of novel PNI treatment methods are typically conducted in experimental settings. One of the widely accepted, albeit imperfect, models of PNI is the transection of the rat sciatic nerve [42, 57], followed by a 9–12-week observation period [42] and assessment of the recovery process through functional-anatomical (SFI evaluation) [43], electrophysiological, and histological analyses [42, 58].
The relationship between three key classes of sciatic nerve status indicators — functional (SFI, locomotor activity, and exteroception), electrophysiological, and morphometric — remains unresolved. Some studies have found no correlation between SFI values and morphometric or electrophysiological parameters in certain nerve injury models ([44], see also [45, 59]), while others suggest a potential correlation for some of these three indicator classes [46, 47, 60] or for specific variables at particular time points during the recovery process [48, 61]. Additionally, several studies using similar sciatic nerve injury models (and various experimental animals) did not specifically investigate the presence of statistically significant correlations between electrophysiological, functional-anatomical, or morphometric parameters (see, for example, [62]). For example, F. Kanaya et al. (1996) [61], using a rat model of sciatic nerve transection or excision and immediate autografting or neurorrhaphy, found after 12 weeks of observation that, when comparing individual values of 14 indicators from three classes (functional-anatomical, electroneuromyographic, and histomorphometric), statistically significant correlations were only found between the SFI, calculated using the primary formula of L. de Medinaceli et al. (1982) [63], and the ratio of fiber and axon diameters, as well as between this form of SFI and the ratio of the thickness of the myelin sheath to the axon diameter. Conversely, C.A. Munro et al. (1998) [44], after analyzing a large sample of animals and finding no correlation between functional-anatomical, electrophysiological, and morphometric parameters at different time points following a 2 cm tibial nerve resection with immediate allografting [64], concluded that the hypothesis of such a mathematical relationship should be rejected.
In the present study, we examined SFI values, M-response latency and amplitude, as well as the density of nerve fibers 12 weeks after PNI modeling. This set of sciatic nerve status indicators and the assessment timeframe are consistent with other studies on experimental PNI [65–67]. The primary finding of our study is the identification of correlations between these parameters in conditions where a wide range of values is present within a single cohort. Such variability could also be obtained within a single experimental group if individual animal data were analyzed at different time points during the recovery process — an approach we plan to implement in future research.
Technical limitations of the study
In addition to the limitations of the SFI-based method for assessing paretic limb function, previously described in our earlier work [49], there are also drawbacks associated with the electroneuromyographic method. First, identifying the optimal recording site for the M-response (the motor point) within the small triceps surae muscle of the rat, especially in the presence of paretic atrophy, is unfeasible. Second, in experiments on small mammals, interindividual variations in M-response latency may be influenced not only by differences in the fiber composition of the injured nerve but also by variations in the trajectory length of the electrically evoked response between the stimulation and recording electrodes. These variations arise from both differences in animal size and discrepancies in the placement of the recording electrode insertion point. Moreover, accurately determining the trajectory length is impossible due to its complex geometry. Under such conditions, even an unlikely measurement error of 5 mm in determining the impulse propagation trajectory — at the highest conduction velocity of ~110 m/s (see [68])—would result in a latency difference of approximately 0.05 ms, while at a conduction velocity of ~50 m/s, the difference would be 0.1 ms. This is comparable to the standard deviation (SD) in the Sham group (~0.1 ms) and significantly smaller than the SD in the Sect and Raph groups (~3.1 and ~1.7 ms, respectively) (Table 2). Given these uncertainties, the interpretation of M-response latency values should be approached with caution, and measuring conduction velocity of the evoked electrical excitation under such experimental conditions should be considered impractical. In this context, it is interesting to note that T.I. Petriv et al. (2023) [69] attributed the unreliability of conduction velocity measurements in small experimental animals to the short distance between the stimulation and recording electrodes. These authors, presumably to reduce interindividual variability, analyzed not the absolute values of M-response amplitude and latency in the paretic limb but their normalized counterparts relative to the contralateral limb [69]. Nonetheless, some studies have attempted to calculate sciatic nerve conduction velocity using average trajectory length values [48, 70].
Thus, it is evident that the future of experimental electrophysiology lies in real-time monitoring techniques — including spontaneous electrical activity recording of paretic muscles [71–73] and stimulated neuromyography [72–74]. However, the development of these approaches remains challenging due to a wide range of technical obstacles [75].
Conclusions
By the 12th week of observation, the SFI values in all studied groups differed significantly. The highest values were observed in the sham-operated group, the lowest in the group where a sciatic nerve transection was modeled, and intermediate values were recorded in the group where immediate suture connection was performed following nerve transection.
The M-response latency significantly differed between the sham-operated and nerve transection groups, as well as between the sham-operated and animals that underwent suture connection of the nerve stumps.
The values of the density of nerve fibers of the proximal part, central part or neuroma, and distal part of the nerve differed significantly when comparing the three samples with each other.
Within each experimental group, a strong negative correlation was identified only between M-response latency and fiber density in the distal nerve segment of animals that underwent suture connection of its stump. However, when data from all three groups were combined into a single cohort, statistically significant correlations emerged between the majority of the studied parameters at the individual level.
Thus, a statistically significant relationship exists between SFI, M-response amplitude, M-response latency, and nerve fiber density, which becomes evident when a sufficient number of observations with a wide range of individual parameter values are analyzed.
Disclosures
Conflict of Interest
The authors declare no conflicts of interest.
Ethical Standards
All procedures performed on the experimental animals complied with ethical guidelines and were approved by the ethics committee of the research institution where the study was conducted.
Funding
This study received no external funding.
References
1. Campbell WW. Evaluation and management of peripheral nerve injury. Clin Neurophysiol. 2008 Sep;119(9):1951-65. https://doi.org/10.1016/j.clinph.2008.03.018
2. Houdek MT, Shin AY. Management and complications of traumatic peripheral nerve injuries. Hand Clin. 2015 May;31(2):151-63. https://doi.org/10.1016/j.hcl.2015.01.007
3. Bhandari PS. Management of peripheral nerve injury. J Clin Orthop Trauma. 2019 Sep-Oct;10(5):862-866. https://doi.org/10.1016/j.jcot.2019.08.003
4. Barnes SL, Miller TA, Simon NG. Traumatic peripheral nerve injuries: diagnosis and management. Curr Opin Neurol. 2022 Dec 1;35(6):718-727. https://doi.org/10.1097/WCO.0000000000001116
5. Bateman EA, Pripotnev S, Larocerie-Salgado J, Ross DC, Miller TA. Assessment, management, and rehabilitation of traumatic peripheral nerve injuries for non-surgeons. Muscle Nerve. 2024 Jun 21. https://doi.org/10.1002/mus.28185
6. Tapp M, Wenzinger E, Tarabishy S, Ricci J, Herrera FA. The Epidemiology of Upper Extremity Nerve Injuries and Associated Cost in the US Emergency Departments. Ann Plast Surg. 2019 Dec;83(6):676-680. https://doi.org/10.1097/SAP.0000000000002083
7. Kim SJ, Kwon YM, Ahn SM, Lee JH, Lee CH. Epidemiology of upper extremity peripheral nerve injury in South Korea, 2008 to 2018. Medicine (Baltimore). 2022 Dec 2;101(48):e31655. https://doi.org/10.1097/MD.0000000000031655
8. Murphy RNA, de Schoulepnikoff C, Chen JHC, Columb MO, Bedford J, Wong JK, Reid AJ. The incidence and management of peripheral nerve injury in England (2005-2020). J Plast Reconstr Aesthet Surg. 2023 May;80:75-85. https://doi.org/10.1016/j.bjps.2023.02.017
9. Zaidman M, Novak CB, Midha R, Dengler J. Epidemiology of peripheral nerve and brachial plexus injuries in a trauma population. Can J Surg. 2024 Jun 26;67(3):E261-E268. https://doi.org/10.1503/cjs.002424
10. Tsymbaliuk V, Luzan B, Tsymbaliuk I. Diagnostics and Treatment of Traumatic Injuries of Peripheral Nerves in Combat Conditions. TRAUMA. 2015 Jul. 7;16(3):13-8. https://doi.org/10.22141/1608-1706.3.16.2015.80206
11. Strafun S, Kurinnyi I, Borzykh N, Tsymbaliuk Y, Shypunov V. Tactics of Surgical Treatment of Wounded with Gunshot Injuries of the Upper Limb in Modern Conditions. TERRA ORTHOPAEDICA. 2021 Oct. 12;(2(109):10-7. https://doi.org/10.37647/0132-2486-2021-109-2-10-17
12. Omid R, Stone MA, Zalavras CG, Marecek GS. Gunshot Wounds to the Upper Extremity. J Am Acad Orthop Surg. 2019 Apr 1;27(7):e301-e310. https://doi.org/10.5435/JAAOS-D-17-00676
13. Aman M, Zimmermann KS, Thielen M, Thomas B, Daeschler S, Boecker AH, Stolle A, Bigdeli AK, Kneser U, Harhaus L. An Epidemiological and Etiological Analysis of 5026 Peripheral Nerve Lesions from a European Level I Trauma Center. J Pers Med. 2022 Oct 8;12(10):1673. https://doi.org/10.3390/jpm12101673
14. Baker HP, Straszewski AJ, Dahm JS, Dickherber JL, Krishnan P, Dillman DB, Strelzow JA. Gunshot-related lower extremity nerve injuries. Eur J Orthop Surg Traumatol. 2023 May;33(4):851-856. https://doi.org/10.1007/s00590-022-03220-3
15. Dugom PM, Jester MP, Archie WH, Huynh DM, Scarcella JF, Guo Y. Outcomes in Ballistic Injuries to the Hand: Fractures and Nerve/Tendon Damage as Predictors of Poor Outcomes. Hand (N Y). 2024 May;19(3):382-386. https://doi.org/10.1177/15589447221092111
16. Muss TE, Hu S, Bauder AR, Lin IC. The Epidemiology, Management, and Outcomes of Civilian Gunshot Wounds to the Upper Extremity at an Urban Trauma Center. Plast Reconstr Surg Glob Open. 2024 Apr 17;12(4):e5753. https://doi.org/10.1097/GOX.0000000000005753
17. Strafun S, Borzykh N, Haiko O, Borzykh O, Gayovich V, Tsymbaliuk Y. Priority directions of surgical treatment of patients with damage to the peripheral nerves of the upper limb in polystructural injuries. TRAUMA. 2018;19(3):75-80. https://doi.org/10.22141/1608-1706.3.19.2018.136410
18. Tsymbaliuk VI, Strafun SS, Tretyak IB, Tsymbaliuk IV, Gatskiy AA, Tsymbaliuk YV, Tatarchuk MM. Surgical treatment of peripheral nerves combat wounds of the extremities. Wiad Lek. 2021;74(3 cz 2):619-624
19. Karsy M, Watkins R, Jensen MR, Guan J, Brock AA, Mahan MA. Trends and Cost Analysis of Upper Extremity Nerve Injury Using the National (Nationwide) Inpatient Sample. World Neurosurg. 2019 Mar;123:e488-e500. https://doi.org/10.1016/j.wneu.2018.11.192
20. Bergmeister KD, Große-Hartlage L, Daeschler SC, Rhodius P, Böcker A, Beyersdorff M, Kern AO, Kneser U, Harhaus L. Acute and long-term costs of 268 peripheral nerve injuries in the upper extremity. PLoS One. 2020 Apr 6;15(4):e0229530. https://doi.org/10.1371/journal.pone.0229530
21. Tan RES, Jeyaratnam S, Lim AYT. Updates in peripheral nerve surgery of the upper extremity: diagnosis and treatment options. Ann Transl Med. 2023 Oct 25;11(11):391. https://doi.org/10.21037/atm-23-1500
22. Foster CH, Karsy M, Jensen MR, Guan J, Eli I, Mahan MA. Trends and Cost-Analysis of Lower Extremity Nerve Injury Using the National Inpatient Sample. Neurosurgery. 2019 Aug 1;85(2):250-256. https://doi.org/10.1093/neuros/nyy265
23. Khalifeh JM, Dibble CF, Dy CJ, Ray WZ. Cost-Effectiveness Analysis of Combined Dual Motor Nerve Transfers versus Alternative Surgical and Nonsurgical Management Strategies to Restore Shoulder Function Following Upper Brachial Plexus Injury. Neurosurgery. 2019 Feb 1;84(2):362-377. https://doi.org/10.1093/neuros/nyy015
24. Raizman NM, Endress RD, Styron JF, Emont SL, Cao Z, Park LI, Greenberg JA. Procedure Costs of Peripheral Nerve Graft Reconstruction. Plast Reconstr Surg Glob Open. 2023 Apr 10;11(4):e4908. https://doi.org/10.1097/GOX.0000000000004908
25. Narayan SK, Arumugam M, Chittoria R. Outcome of human peripheral nerve repair interventions using conduits: a systematic review. J Neurol Sci. 2019 Jan 15;396:18-24. https://doi.org/10.1016/j.jns.2018.10.012
26. Lopes B, Sousa P, Alvites R, Branquinho M, Sousa AC, Mendonça C, Atayde LM, Luís AL, Varejão ASP, Maurício AC. Peripheral Nerve Injury Treatments and Advances: One Health Perspective. Int J Mol Sci. 2022 Jan 14;23(2):918. https://doi.org/10.3390/ijms23020918
27. Frostadottir D, Chemnitz A, Johansson Ot LJ, Holst J, Dahlin LB. Evaluation of Processed Nerve Allograft in Peripheral Nerve Surgery: A Systematic Review and Critical Appraisal. Plast Reconstr Surg Glob Open. 2023 Jun 27;11(6):e5088. https://doi.org/10.1097/GOX.0000000000005088
28. Harley-Troxell ME, Steiner R, Advincula RC, Anderson DE, Dhar M. Interactions of Cells and Biomaterials for Nerve Tissue Engineering: Polymers and Fabrication. Polymers (Basel). 2023 Sep 7;15(18):3685. https://doi.org/10.3390/polym15183685
29. Pereira CT, Hill EE, Stasyuk A, Parikh N, Dhillon J, Wang A, Li A. Molecular Basis of Surgical Coaptation Techniques in Peripheral Nerve Injuries. J Clin Med. 2023 Feb 16;12(4):1555. https://doi.org/10.3390/jcm12041555
30. Thamm OC, Eschborn J, Schäfer RC, Schmidt J. Advances in Modern Microsurgery. J Clin Med. 2024 Sep 6;13(17):5284. https://doi.org/10.3390/jcm13175284
31. Gordon T. Peripheral Nerve Regeneration and Muscle Reinnervation. Int J Mol Sci. 2020 Nov 17;21(22):8652. https://doi.org/10.3390/ijms21228652
32. Terenghi G, Hart A, Wiberg M. The nerve injury and the dying neurons: diagnosis and prevention. J Hand Surg Eur Vol. 2011 Nov;36(9):730-4. https://doi.org/10.1177/1753193411422202
33. Liu Y, Wang H. Peripheral nerve injury induced changes in the spinal cord and strategies to counteract/enhance the changes to promote nerve regeneration. Neural Regen Res. 2020 Feb;15(2):189-198. https://doi.org/10.4103/1673-5374.265540
34. Pottorf TS, Rotterman TM, McCallum WM, Haley-Johnson ZA, Alvarez FJ. The Role of Microglia in Neuroinflammation of the Spinal Cord after Peripheral Nerve Injury. Cells. 2022 Jun 30;11(13):2083. https://doi.org/10.3390/cells11132083
35. Li C, Liu SY, Pi W, Zhang PX. Cortical plasticity and nerve regeneration after peripheral nerve injury. Neural Regen Res. 2021 Aug;16(8):1518-1523. https://doi.org/10.4103/1673-5374.303008
36. Shen J. Plasticity of the Central Nervous System Involving Peripheral Nerve Transfer. Neural Plast. 2022 Mar 18;2022:5345269. https://doi.org/10.1155/2022/5345269
37. Xiang YT, Wu JJ, Ma J, Xing XX, Zhang JP, Hua XY, Zheng MX, Xu JG. Peripheral nerve transfers for dysfunctions in central nervous system injuries: a systematic review. Int J Surg. 2024 Jun 1;110(6):3814-3826. https://doi.org/10.1097/JS9.0000000000001267
38. Goncharuk O, Savosko S, Petriv T, Medvediev V, Tsymbaliuk V. Quantitative histological assessment of skeletal muscle hypotrophy after neurotomy and sciatic nerve repair in rats. Georgian Med News. 2021 Apr;(313):169-172. https://www.geomednews.com/v313i4.html
39. Goncharuk O, Savosko S, Tykhomyrov A, Guzyk M, Medvediev V, Tsymbaliuk V, Chaikovsky Y. Matrix Metalloproteinase-9 is Involved in the Fibrotic Process in Denervated Muscles after Sciatic Nerve Trauma and Recovery. J Neurol Surg A Cent Eur Neurosurg. 2023 Mar;84(2):116-122. https://doi.org/10.1055/s-0041-1731750
40. Lysak A, Farnebo S, Geuna S, Dahlin LB. Muscle preservation in proximal nerve injuries: a current update. J Hand Surg Eur Vol. 2024 Jun;49(6):773-782. https://doi.org/10.1177/17531934231216646
41. Supra R, Agrawal DK. Peripheral Nerve Regeneration: Opportunities and Challenges. J Spine Res Surg. 2023;5(1):10-18. https://doi.org/10.26502/fjsrs0052
42. Vela FJ, Martínez-Chacón G, Ballestín A, Campos JL, Sánchez-Margallo FM, Abellán E. Animal models used to study direct peripheral nerve repair: a systematic review. Neural Regen Res. 2020 Mar;15(3):491-502. https://doi.org/10.4103/1673-5374.266068
43. DeLeonibus A, Rezaei M, Fahradyan V, Silver J, Rampazzo A, Bassiri Gharb B. A meta-analysis of functional outcomes in rat sciatic nerve injury models. Microsurgery. 2021 Mar;41(3):286-295. https://doi.org/10.1002/micr.30713
44. Munro CA, Szalai JP, Mackinnon SE, Midha R. Lack of association between outcome measures of nerve regeneration. Muscle Nerve. 1998 Aug;21(8):1095-7. https://doi.org/10.1002/(sici)1097-4598(199808)21:8<1095::aid-mus20>3.0.co;2-s
45. Varejão AS, Meek MF, Ferreira AJ, Patrício JA, Cabrita AM. Functional evaluation of peripheral nerve regeneration in the rat: walking track analysis. J Neurosci Methods. 2001 Jul 15;108(1):1-9. https://doi.org/10.1016/s0165-0270(01)00378-8
46. Monte-Raso VV, Barbieri CH, Mazzer N, Yamasita AC, Barbieri G. Is the Sciatic Functional Index always reliable and reproducible? J Neurosci Methods. 2008 May 30;170(2):255-61. https://doi.org/10.1016/j.jneumeth.2008.01.022
47. Wang T, Ito A, Aoyama T, Nakahara R, Nakahata A, Ji X, Zhang J, Kawai H, Kuroki H. Functional evaluation outcomes correlate with histomorphometric changes in the rat sciatic nerve crush injury model: A comparison between sciatic functional index and kinematic analysis. PLoS One. 2018 Dec 12;13(12):e0208985. https://doi.org/10.1371/journal.pone.0208985
48. Goncharuk OO, Savosko SI, Petriv TI, Tatarchuk MM, Medvediev VV, Tsymbaliuk VI. Correlation analysis of electroneuromyographic, functional-anatomical and morphometric indicators of regeneration of the injured sciatic nerve. Ukr Neurosurg J. 2021 Jun. 27; 27(2): 34-40. https://doi.org/10.25305/unj.227615
49. Melikov ZK, Medvediev VV. The rat's sciatic nerve functional index dynamics after its transection and recovery by means of epineural neurorrhaphy. Ukr Neurosurg J. 2024; 30(4):30-42. https://doi.org/10.25305/unj.310430
50. Dellon ES, Dellon AL. Functional assessment of neurologic impairment: track analysis in diabetic and compression neuropathies. Plast Reconstr Surg. 1991 Oct;88(4):686-94. https://doi.org/10.1097/00006534-199110000-00020
51. Tsymbalyuk VI, Molotkovets VY, Petriv TI, Medvedev VV, Luzan BM, inventors; O.O. Bogomolets National Medical University, assignee. Method for determining the functional index of the sciatic nerve in a rat. Patent of Ukraine 118156. 2017 July 25.
52. Petriv TI, Tsymbalyuk YV, Potapov OO, Kvasnitsʹkyy MV, Honcharuk OO, Tatarchuk MM. Stem cell technology in peripheral nerve restoration. East. Ukr. Med. J. 2020; 8(2): 210-29. https://doi.org/10.21272/eumj.2020;8(2):210-229.
53. Lischer M, di Summa PG, Petrou IG, Schaefer DJ, Guzman R, Kalbermatten DF, Madduri S. Mesenchymal Stem Cells in Nerve Tissue Engineering: Bridging Nerve Gap Injuries in Large Animals. Int J Mol Sci. 2023 Apr 25;24(9):7800. https://doi.org/10.3390/ijms24097800
54. Stocco E, Barbon S, Emmi A, Tiengo C, Macchi V, De Caro R, Porzionato A. Bridging Gaps in Peripheral Nerves: From Current Strategies to Future Perspectives in Conduit Design. Int J Mol Sci. 2023 May 24;24(11):9170. https://doi.org/10.3390/ijms24119170
55. Khaled MM, Ibrahium AM, Abdelgalil AI, El-Saied MA, El-Bably SH. Regenerative Strategies in Treatment of Peripheral Nerve Injuries in Different Animal Models. Tissue Eng Regen Med. 2023 Oct;20(6):839-877. https://doi.org/10.1007/s13770-023-00559-4
56. Aisaiti A, Aierxiding S, Shoukeer K, Muheremu A. Mesenchymal stem cells for peripheral nerve injury and regeneration: a bibliometric and visualization study. Front Neurol. 2024 Aug 5;15:1420402. https://doi.org/10.3389/fneur.2024.1420402
57. Li A, Pereira C, Hill EE, Vukcevich O, Wang A. In Vitro, In Vivo and Ex Vivo Models for Peripheral Nerve Injury and Regeneration. Curr Neuropharmacol. 2022;20(2):344-361. https://doi.org/10.2174/1570159X19666210407155543
58. Cui S, Li K, Xu M, Yu W. Effect of Reneurorrhaphy of Distal Coaptation on Nerve Regeneration After Nerve Grafting: Animal Experimental Study. World Neurosurg. 2019 Feb;122:e1365-e1373. https://doi.org/10.1016/j.wneu.2018.11.049
59. Shenaq JM, Shenaq SM, Spira M. Reliability of sciatic function index in assessing nerve regeneration across a 1 cm gap. Microsurgery. 1989;10(3):214-9. https://doi.org/10.1002/micr.1920100315
60. Oliveira EF, Mazzer N, Barbieri CH, Selli M. Correlation between functional index and morphometry to evaluate recovery of the rat sciatic nerve following crush injury: experimental study. J Reconstr Microsurg. 2001 Jan;17(1):69-75. https://doi.org/10.1055/s-2001-12691
61. Kanaya F, Firrell JC, Breidenbach WC. Sciatic function index, nerve conduction tests, muscle contraction, and axon morphometry as indicators of regeneration. Plast Reconstr Surg. 1996 Dec;98(7):1264-71, discussion 1272-4. https://doi.org/10.1097/00006534-199612000-00023
62. Likhodiievskyi V, Korsak A, Skopets D, Olefir S, Chukhrai S, Shamalo S, Chaikovsky Y. Long-term outcomes of rat sciatic nerve injury and its grafting with silicon wires-based conduit: Distal nerve stump histology and electromyography results. Medical Science of Ukraine. 2019Dec.26;15(3-4):3-9. https://doi.org/10.32345/2664-4738.3-4.2019.01
63. de Medinaceli L, Freed WJ, Wyatt RJ. An index of the functional condition of rat sciatic nerve based on measurements made from walking tracks. Exp Neurol. 1982 Sep;77(3):634-43. https://doi.org/10.1016/0014-4886(82)90234-5
64. Midha R, Mackinnon SE, Evans PJ, Best TJ, Hare GM, Hunter DA, Falk-Wade JA. Comparison of regeneration across nerve allografts with temporary or continuous cyclosporin A immunosuppression. J Neurosurg. 1993 Jan;78(1):90-100. https://doi.org/10.3171/jns.1993.78.1.0090
65. Li Y, Yao D, Zhang J, Liu B, Zhang L, Feng H, Li B. The Effects of Epidermal Neural Crest Stem Cells on Local Inflammation Microenvironment in the Defected Sciatic Nerve of Rats. Front Mol Neurosci. 2017 May 22;10:133. https://doi.org/10.3389/fnmol.2017.00133
66. Moattari M, Moattari F, Kaka G, Mohseni Kouchesfehani H, Sadraie SH, Naghdi M, Mansouri K. Evaluation of dexamethasone treated mesenchymal stem cells for recovery in neurotmesis model of peripheral nerve injury. Neurol Res. 2018 Dec;40(12):1060-1070. https://doi.org/10.1080/01616412.2018.1517859
67. Shen X, Qu F, Pei Y, Lei S, Xia S, Liang J, Li S, Sun X, Liu L. Repairing sciatic nerve injury with self-assembling peptide nanofiber scaffold-containing chitosan conduit. Front Neurol. 2022 Oct 13;13:867711. https://doi.org/10.3389/fneur.2022.867711
68. Hursh JB. Conduction velocity and diameter of nerve fibers. Am J Physiol. 1939;127:131–9. https://doi.org/10.1152/ajplegacy.1939.127.1.131
69. Petriv T, Daoud Almhairat RM, Tatarchuk M, Luzan B, Tsymbaliuk J, Tsymbaliuk V. Long-term invasive electrical stimulation of peripheral nerve in the functional recovery of neuromuscular complex in experiment. INTERNATIONAL NEUROLOGICAL JOURNAL. 2023 Sep. 8; 19(4): 109-15. https://doi.org/10.22141/2224-0713.19.4.2023.1008
70. Tsymbaliuk VI, Molotkovets VY, Medvediev VV, Luzan BM, Turuk LS, Tatarchuk ММ, Draguntsova NG. Electroneuromyographic correlates of sciatic nerve function restoration after its resection and welded epineural coaptation in the experiment. Ukr Neurosurg J. 2017 Jun. 17; (2): 44-9. https://doi.org/10.25305/unj.104503
71. Gramsbergen A, IJkema-Paassen J, Meek MF. Sciatic nerve transection in the adult rat: abnormal EMG patterns during locomotion by aberrant innervation of hindleg muscles. Exp Neurol. 2000 Jan;161(1):183-93. https://doi.org/10.1006/exnr.1999.7233
72. English AW, Chen Y, Carp JS, Wolpaw JR, Chen XY. Recovery of electromyographic activity after transection and surgical repair of the rat sciatic nerve. J Neurophysiol. 2007 Feb;97(2):1127-34. https://doi.org/10.1152/jn.01035.2006
73. Chen Y, Wang Y, Chen L, Sun C, English AW, Wolpaw JR, Chen XY. H-reflex up-conditioning encourages recovery of EMG activity and H-reflexes after sciatic nerve transection and repair in rats. J Neurosci. 2010 Dec 1;30(48):16128-36. https://doi.org/10.1523/JNEUROSCI.4578-10.2010
74. Lee B, Koripalli MK, Jia Y, Acosta J, Sendi MSE, Choi Y, Ghovanloo M. An Implantable Peripheral Nerve Recording and Stimulation System for Experiments on Freely Moving Animal Subjects. Sci Rep. 2018 Apr 17;8(1):6115. https://doi.org/10.1038/s41598-018-24465-1
75. Restaino SM, Abliz E, Wachrathit K, Krauthamer V, Shah SB. Biomechanical and functional variation in rat sciatic nerve following cuff electrode implantation. J Neuroeng Rehabil. 2014 Apr 23;11:73. https://doi.org/10.1186/1743-0003-11-73